Server Monitor: Show Monitoring
You can call up the display of the Server Monitor by double-clicking on the tray icon or by right-clicking it and selecting Show monitoring.
With a click on  you can add a server monitoring there.
Server applications already in the list can be opened by double-clicking or selecting and clicking on  .
.
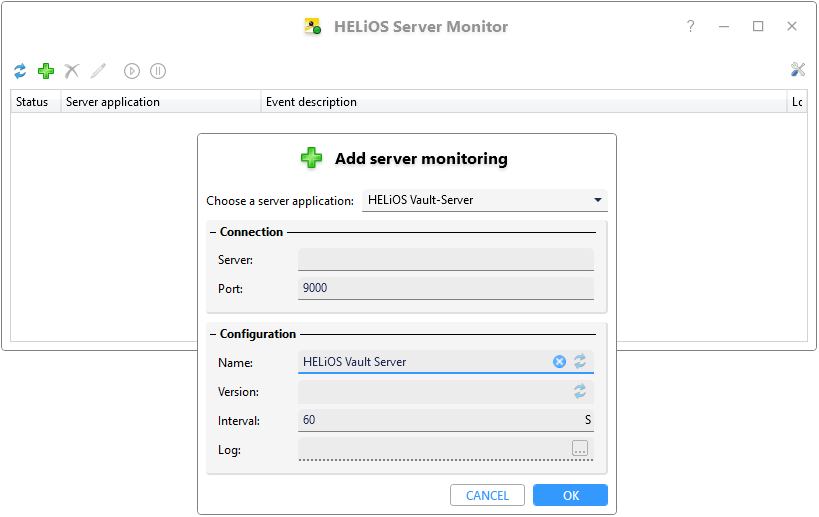
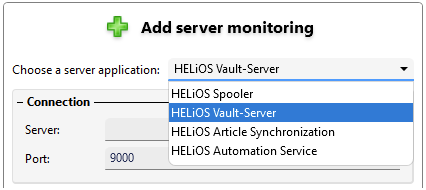
For new entries, select the type of server application at the top of the window, HELiOS Spooler, HELiOS Vault Server, HELiOS Article Synchronization or HELiOS Automation Service.
Below that, the window is divided into the areas Connection and Configuration:
|
Connection |
|
|
Server |
Here you must enter the computer name or the IP address of the server whose operation is to be monitored. The combination of Server and Port (see below) must be unique and cannot be entered more than once. |
|
Port |
When selecting the server application at the top of the window ( HELiOS Spooler, HELiOS Vault Server or HELiOS Article Synchronization), HELiOS' corresponding default port for the respective server application is entered here. If your server is running on a different port, you have to change the port number here manually. |
|
Configuration |
|
|
Name |
After the Server and Port fields have been filled in, the default name is requested and entered by the server application. It can be changed manually by the user with an own meaningful name of his choice. A click on the Update |
|
Version |
This field displays the version of the server application analogous to the name (see above). For the Vault Server this is the logical name as specified during installation and can be edited with VSConfig.exe. A click on the Update |
|
Interval |
The Interval value is the query interval for monitoring the server application in seconds. |
|
Log |
Here you have the optional possibility to specify a log file path. In case of malfunctions you can also view details on errors here.
|
 symbol next to the input field resets the entry to the default name issued by the server application.
  The log file directory for the HELiOS Article Synchronisation Service (%PUBLIC%\Documents\ISD Software und Systeme\HELiOS Coupling\log\Helios.SyncService.log) is not enabled for access "from outside" by default. This can be changed by administrators as needed to use the log option.
An example for the entry of a Vault Server:
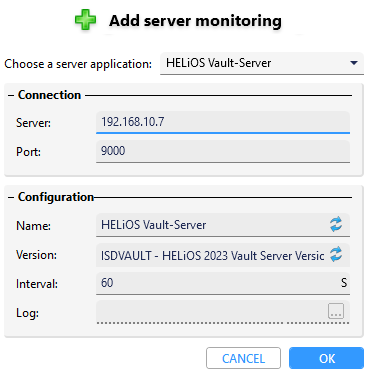
Confirm your new entry or change with OK
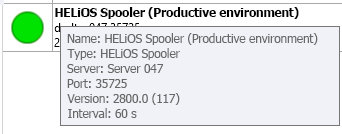
A correctly entered, running server application is marked with a green dot in the display under Status.
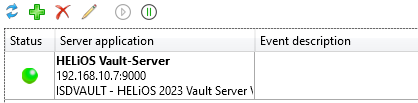
You can obtain further information on monitoring via the mouseover tooltip:
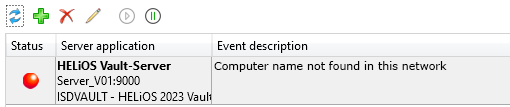
In the case of incorrect entries or an application that is not running correctly for other reasons, the icon turns red under You will see information about this under Event description.
An orange dot under Status indicates that the server application is running with errors.
For example, failed jobs of the HELiOS Spooler will lead to a corresponding error output.

If the Spooler jobs were then successfully repeated or removed from the queue, the error count is automatically updated and, if applicable, also the Status.
A red dot under Status means that the server application is not running.
This means that the server application has not started or there is an error that has caused the execution to be aborted.
If a Stop  symbol is displayed under Status, the monitoring of the server application is not started at this moment (e.g. because the monitoring settings are being edited or because the monitoring has been stopped).
If you have defined the path for a log file (see above), an open file icon appears in the corresponding column of the Server Monitor window, which can be used to open the log file directly.
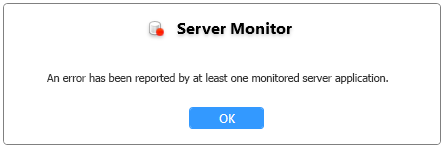
An error of the server operation is also reported by a message box.
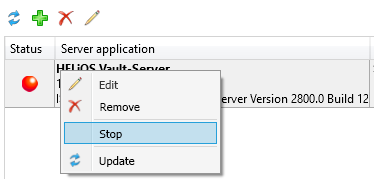
With the context menu function Stop you can also stop servers in the view if require; alternatively, by selecting them and clicking the Stop symbol at the top of the window.
Choosing then Update  function in the in the context menu updates the status display for the selected server, clicking the symbol at the top of the window updates the entire list.
Both the context menu function Edit and the symbol at the top of the window (or a double-click) can be used to edit a server, and clicking the Remove  icon deletes the highlighted server from monitoring.

