P+ID Library > Symbol > Edit library symbol > Show inheritance graph ![]()
Right-click DMO template > Show inheritance graph ![]()
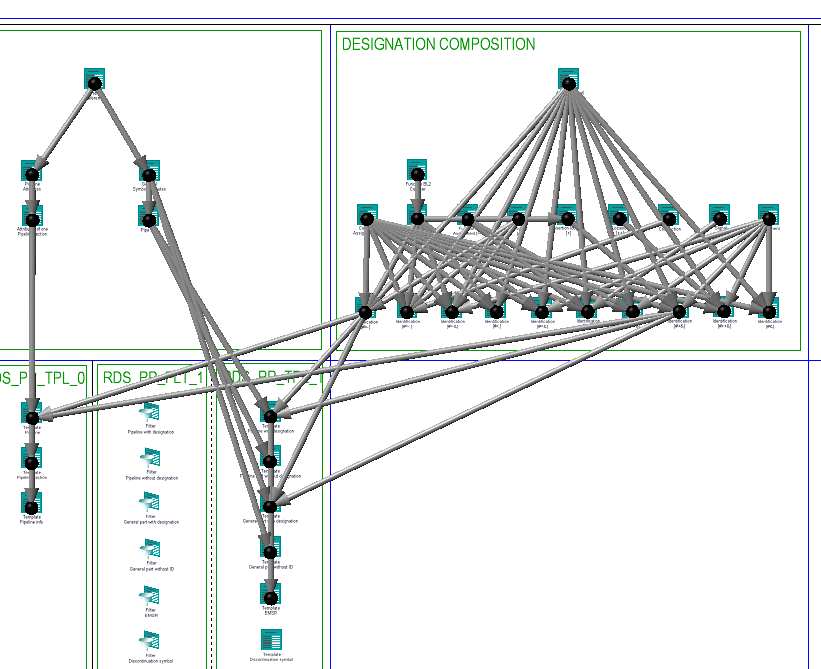
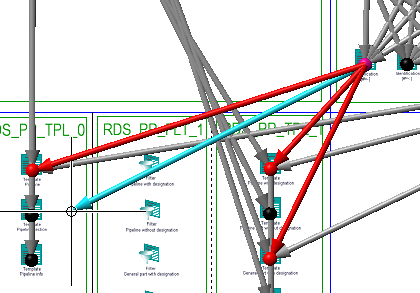
You have the option to visualize the derivation relations between data mask objects in a DMO library with the help of inheritance graphs. You can scroll over the inheritance graph and highlight the inheritance paths, starting from the node where the cursor is located, in a different colour. Also, you can define new derivation relations to the current node in the process.
When you call the function, the inheritance graph will appear as shown below:
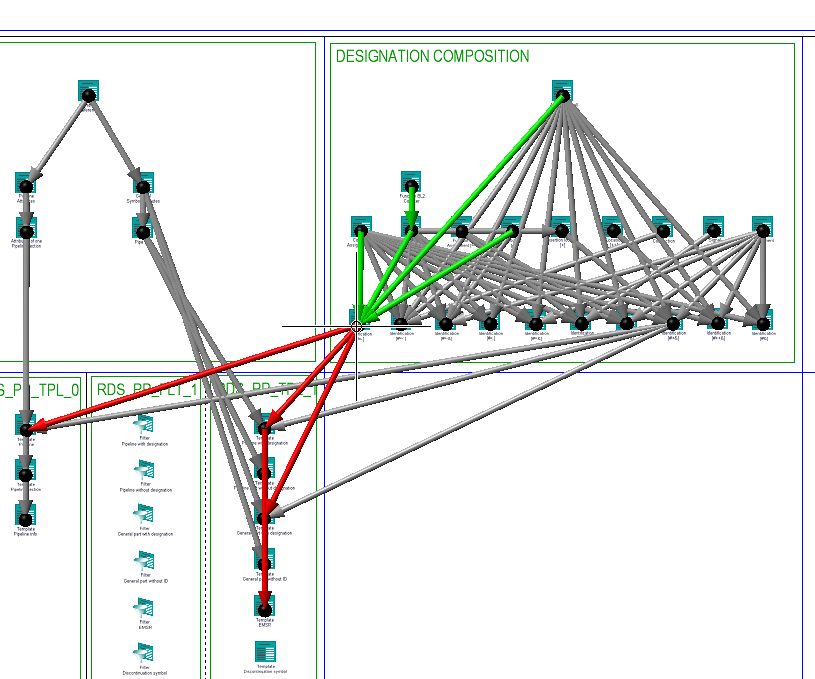
When you move the cursor to a node, the inheritance paths from this particular node will be highlighted in a different colour.
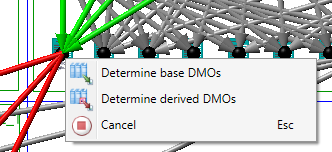
You can right-click and call the functions Determine base DMOs and Determine derived DMOs. These functions allow you to define further base DMOs or derived DMOs form a particular node, while the inheritance graph will remain visible.
If further base DMOs are to be set, the following arrow will be visible:
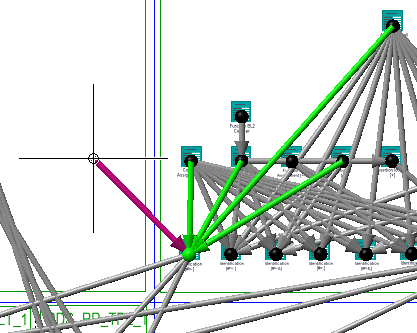
If further derived DMOs are to be set, the following arrow will be visible:
Press the middle mouse button or the ESC key to cancel the function.

Related Topics
Manage and Edit Library Symbols (P+ID) • New Library Symbol (P+ID) • Management of Configurable Genaral Data Masks in DMOs (P+ID)
|
Version 2102 - HiCAD P+ID | Date: 15/11/2016 | © Copyright 1994-2016, ISD Software und Systeme GmbH |