Plant Engineering > Guideline Tools > Create guideline
HiCAD enables a quick and intuitive creation and processing of guidelines thanks to combined numeric and graphic value input i.e. the display of the guideline points in conjunction with a flexible grid and axes system . When you call the function, the Process c-edge dialogue will be displayed.
The window can be divided into the following areas:
If you have defined a greater number of axes for the routing of guidelines, the identification of a particular axis may be difficult owing to the multitude of axes. In such cases, the deactivation of axes in the axes table is also rather difficult. In such cases you have the option to switch axes on or off that are located in the planes spanned by the axes of the active coordinate systems. If you want to hide axes in a particular plane, deactivate the corresponding checkbox below Plane. Activate the Others checkbox to hide/show axes which are not located in one of these planes.
The graphic display changes with the settings in the window:
Proceed as follows:
Graphic cursor
The selected point is inserted in the drawing. In the coordinates table, the original, suggested values are overwritten by the coordinates of the point. In the next row of the coordinates table, the same coordinates are initially suggested for the next point. The function is now ready for the specification of the next point.
Coordinates table
If you double-click on an entry in the table, you can manually enter a new coordinate value. Confirm with ENTER to take over the specified value. If you now move the mouse pointer in the graphic window you will see the point for the new position in the graphic.
Move the mouse pointer back to the coordinates table and place it in the empty space under the coordinate specifications. Right-click and select Insert.
In the next row of the table, the same coordinates are initially suggested for the next point. The function is now ready for the specification of the next point.
The result will look as follows:
You can now process the created guideline further in many different ways. The options are the same as for the Process guideline function:
|
OK |
The guideline is confirmed and applied to the layout plan. The window is closed and the function ended. |
|
Cancel |
The guideline is rejected and deleted from the graphic. The window is closed and the function ended. |
|
Besides defining the colour settings, you have the option to determine the position of the grid. |
|
|
|
Save points list of guideline Use this button to save the points list of a guideline. In the created text file the table columns will automatically be separated by tab stops. Select the folder and the file type and enter the file name. |
|
|
Load points list Use this button to load the points of a guideline from a text file. Please note the following:
|
 Please note:
Example:
In the image below, the end points of a cuboid's lower edge are identified.
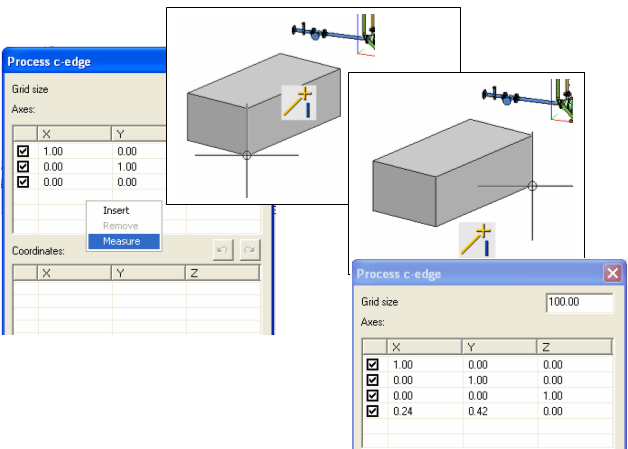
Place the mouse pointer under the last row of the axes table. Right-click to open a context menu and select Pick. Now identify the two points that are to determine the axis direction. The associated X, Y and Z-values are automatically entered into the table.

Related Topics
Guideline Tools (PE) • Plant Engineering Functions
|
Version 2102 - HiCAD Plant Engineering | Date: 15/11/2016 | © Copyright 1994-2016, ISD Software und Systeme GmbH |